How to Choose Packaging Equipment in 2026?
How to Choose Packaging Equipment in 2026? The decision now reaches beyond speed and purchase price. Packaging Equipment must support labor efficiency, material changes, product safety, and measurable sustainability goals. A machine that runs quickly but creates excessive waste may become an expensive mistake.
PMMI’s 2024 State of the Industry report identified labor shortages, automation, and supply-chain pressure as major forces shaping packaging machinery investment. Its data also placed U.S. packaging machinery shipments above $10 billion in 2023. Smithers expects continued growth in global packaging machinery demand, driven by food, beverage, healthcare, and e-commerce applications. These figures show opportunity. They do not remove uncertainty.
“The packaging machinery industry continues to evolve as manufacturers respond to changing consumer preferences and operational challenges,” says Jorge Izquierdo, vice president of market development at PMMI. His observation matters because equipment choices must reflect real production conditions. Consider a filling line during a humid shift. Watchoversized cartons move through a narrow warehouse door. Examine changeover time, cleaning access, spare-part availability, and operator training. Small details often decide long-term performance.
This guide compares automation levels, machine flexibility, integration requirements, energy use, and total cost of ownership. It also questions popular assumptions. More automation is not always better. A cheaper machine may cost more after three years. Even respected industry reports cannot replace a factory-floor assessment. The right Packaging Equipment should fit today’s operation while leaving room for tomorrow’s products, regulations, and customer expectations.
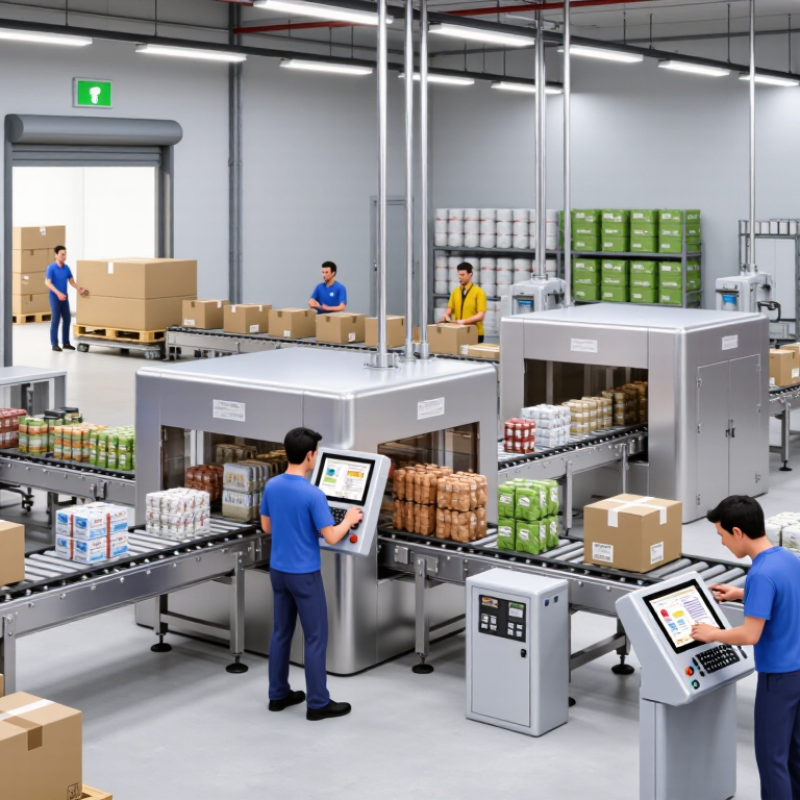
Define 2026 Packaging Needs Using SKU Mix, Volume, and 20% Capacity Headroom
How to Choose Packaging Equipment in 2026?
Packaging equipment decisions should begin with the SKU mix, not the machine catalog. List every format, material, closure, and pack size sold in 2026. Then measure weekly units, peak-day demand, and changeovers per shift. PMMI’s 2024 State of the Industry report valued U.S. packaging machinery shipments above $10 billion in 2023. That scale reflects serious investment, but it does not justify buying maximum speed.
Build a capacity model for each SKU family. Divide required units by available production minutes, then add 20% headroom. For example, 48,000 weekly packs across 40 hours require 1,200 packs per hour. A practical target becomes 1,440 packs per hour. Keep high-volume SKUs on the longest runs. Reserve flexible equipment for smaller batches and frequent format changes. Smithers’ market analysis also identifies continued packaging growth through 2028, so demand planning should not rely only on current orders.
Peak demand matters more than averages. Averages can mislead. I have seen lines appear efficient until a holiday promotion doubled changeovers. Include sanitation, maintenance, operator breaks, material loading, and rejected packs in the calculation. PMMI’s workforce research continues to highlight labor availability as a major operational concern. Therefore, evaluate automation by labor savings and recovery time, not speed alone. A spreadsheet can still lie. Validate its assumptions with three months of actual production records, including the worst shift.
Choose Automation Levels with a Target ROI Payback of 2–3 Years
How to Choose Packaging Equipment in 2026?
Choose Automation Levels with a Target ROI Payback of 2–3 Years
The right automation level should support a measurable two- to three-year payback. Start with real production data, not a supplier’s best-case estimate. Record units per hour, changeover time, labor hours, scrap, maintenance, and unplanned stops. A machine processing 60 packs per minute may look attractive. However, frequent format changes can erase its expected savings. Calculate the annual benefit after training, spare parts, energy, integration, and financing costs.
Match automation to your operational stability. Semi-automatic equipment may suit variable products and shorter runs. Fully automatic systems can deliver stronger returns when demand is consistent and labor costs remain significant. Ask your production and maintenance teams to review the proposal together. Their practical experience often reveals hidden requirements, such as limited floor space, difficult cleaning access, or inconsistent packaging materials. These details affect uptime and payback.
Tips: Build a simple three-year spreadsheet. Test conservative, expected, and optimistic scenarios. Include two weeks of downtime each year. That may feel excessive. It is not always excessive. Measure actual output during a pilot or factory acceptance test. Confirm changeover minutes with your own operators, not only technical staff. Review the calculation every quarter after installation. A disappointing result does not always mean the equipment failed; weak scheduling, poor training, or unstable upstream processes may be responsible. Leave room for correction. Payback models are useful, but they are still models.
How to Choose Packaging Equipment in 2026? — Choose Automation Levels with a Target ROI Payback of 2–3 Years
| Automation level |
Typical equipment scope |
Typical installed investment |
Indicative throughput |
Direct labor requirement |
Estimated annual operating savings* |
Indicative payback |
Best fit in 2026 |
| Manual / assisted |
Workstations, conveyors, hand tools, basic weighing and labeling |
US$25,000–60,000 |
10–25 packages per minute |
2–4 operators per shift |
US$5,000–20,000 |
Usually above 3 years |
Low-volume production, frequent changeovers, high product variation |
| Semi-automatic |
Automatic filling or sealing combined with manual loading and case handling |
US$75,000–180,000 |
25–60 packages per minute |
1–2 operators per shift |
US$35,000–85,000 |
1.5–3.5 years |
Growing volumes, moderate SKU variety, and facilities seeking a controlled first automation step |
| Fully automatic cell |
Automatic product feeding, filling, sealing, coding, inspection and discharge |
US$200,000–450,000 |
60–120 packages per minute |
0.5–1 operator per shift |
US$90,000–190,000 |
1.8–3.2 years |
Stable product formats, two- or three-shift operation, and consistent demand |
| Integrated line |
Upstream processing interface, primary packaging, secondary packaging, palletizing and line controls |
US$500,000–1,200,000+ |
100–240 packages per minute |
0.5–1 operator per shift, plus maintenance support |
US$180,000–450,000 |
2.0–4.5 years |
High-volume production with long campaigns, limited format changes and strong capacity utilization |
Recommended target:
Select an automation level that reaches a calculated payback of approximately 2–3 years under realistic production volumes, labor rates, uptime and changeover assumptions.
Investment rule:
Include equipment, installation, integration, guarding, training, commissioning, spare parts and facility modifications in the total installed investment.
Payback formula:
Payback period = total installed investment ÷ annual net cash savings. Net savings should account for labor, material waste, maintenance, energy, downtime and quality-related costs.
*Planning ranges are indicative industry benchmarks for 2026 and vary by product characteristics, package size, line speed, labor cost, operating shifts, changeover frequency, utilization and local installation requirements. Validate the figures with a site-specific production and total-cost-of-ownership assessment.
Calculate Five-Year TCO Across Labor, Energy, Maintenance, and Downtime
Choosing packaging equipment in 2026 requires more than comparing purchase prices. Build a five-year total cost of ownership model first. Include equipment cost, installation, training, spare parts, utilities, labor, and downtime. The U.S. Bureau of Labor Statistics reported that wages represented 70.1% of private-industry compensation in December 2024. That makes labor efficiency a major cost variable. Calculate operator hours saved per shift, then multiply them by the fully loaded hourly rate. Do not use wages alone.
Energy deserves a site-specific estimate. The U.S. Energy Information Administration shows large differences in industrial electricity prices across states. Record actual machine load, operating hours, and local tariffs. Maintenance should include scheduled service, consumables, technician time, and emergency repairs. PMMI research continues to identify labor availability and automation skills as important packaging challenges. Downtime needs its own line. Multiply lost production hours by contribution margin, not revenue. Add restart waste and overtime.
My first spreadsheet assumed constant output. That was too optimistic. Test low, expected, and high downtime scenarios. For example, 120 lost hours annually can exceed several years of energy savings. Track fault history from comparable equipment, if available. Challenge every supplier estimate with plant records and a witnessed trial. A cheaper machine may still lose financially through frequent stoppages, longer changeovers, or difficult cleaning access. Five-year TCO should be recalculated after commissioning, because real conditions often disagree with the sales model.
How to Choose Packaging Equipment in 2026?
Calculate Five-Year TCO Across Labor, Energy, Maintenance, and Downtime
Five-year total cost of ownership is shown in USD for three equipment automation levels. The benchmark assumes two production shifts, 250 operating days per year, electricity at $0.12/kWh, scheduled maintenance, and the estimated production cost of unplanned downtime. Semi-automatic equipment produces the lowest modeled five-year TCO because it reduces labor substantially without the higher acquisition, energy, and maintenance costs of a fully automatic system.